June 30, 2025 Winter 2025
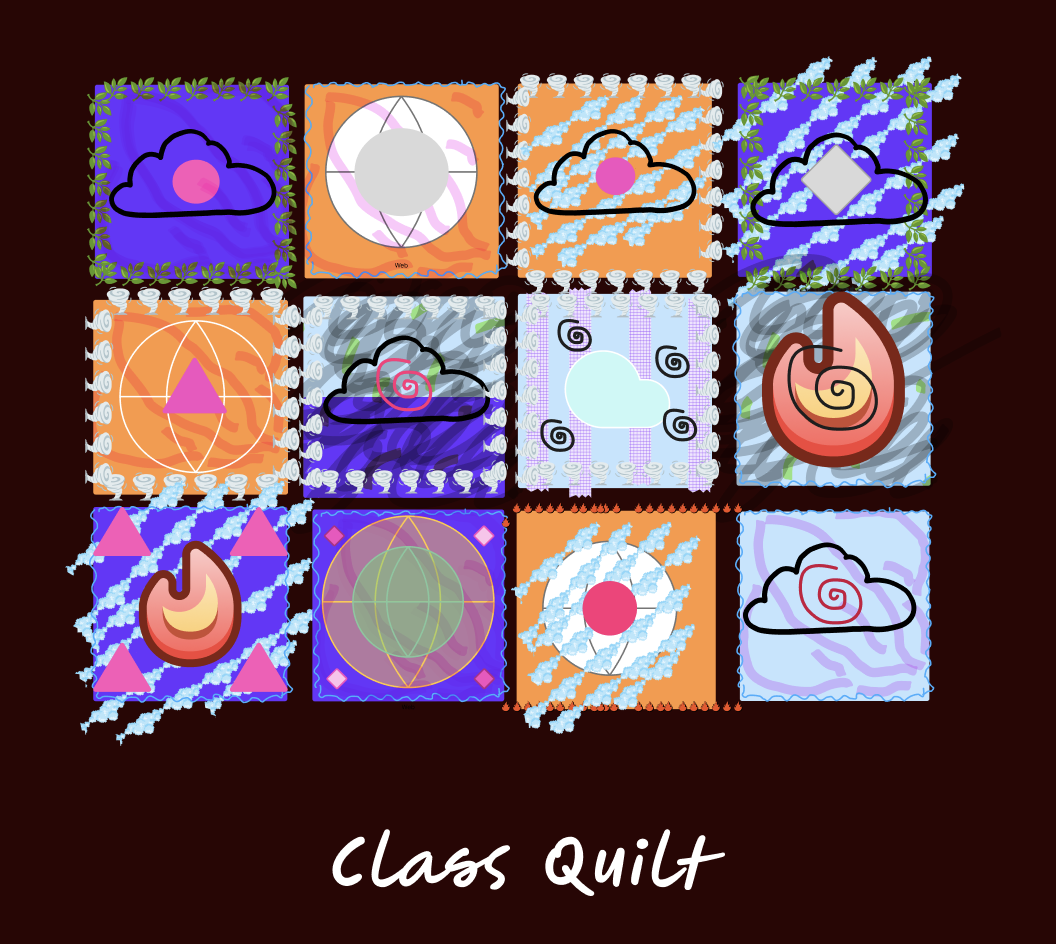
Class Quilt: 12 squares arranged in a “quilt” each feature variations of the same patterns and symbols colors and borders.
Who are we? Where are we now and where did we come from?
Class begins and ends with the data most personal to us.
On the first day of class, we use a map to share the data of our lives and our families, attempting to tell the stories of our lives from the plot points—and soon enough, we are confronted with its limitations. The map does not show the movement of people. It doesn't show how interesting our chosen families are or how we chose to build them. Degrees of specificity are missing, as are the histories, language, cultural context, and political borders that shape our stories.
So begins the messy, fuzzy world of talking about data—trying to make sense of what is given, that which, when visualized convincingly, we often trust without question. Meghna grounds us with a definition that serves as an anchor point for the following weeks: simply put, data are observations of the changing world. We accept that data is a verb.
In both iterations of class, we come together as artists, designers, engineers, analysts, writers, technologists, activists, researchers, musicians. Data seems like serious work, but we are here to play.
To do this, we must let go of perfection.
Our goal is to focus on our individual personal data. Staying close to the source actually opens things up—it gives us space to explore.
We spend much of our class doing sketches by hand: quick estimations and recordings of the world around us. It is freeing. Eventually, in the final weeks, we take what we've learned (or maybe forget it) and give drawing by intuition a try.
To me, data has always seemed flat. In the everyday, I’m used to the impersonal experience of needing to data-ify my existence—through demographic forms, grant applications, needing to prove my worthiness or neediness through metrics. Data is an overwhelming, indecipherable stream of information that’s being tracked and recorded against my will. I have chosen to accept the terms and conditions—and ignore it.
What I like about drawing data by hand is that it takes that concept and flips it on its head. Drawing our personal data gives it a new dimension.
Meg leads us through the seemingly infinite methods of collecting, arranging, and cataloguing data. And since the point is that there’s no one way to visualize, we also lead ourselves.
Over time, and through both sessions, it’s clear that we share a kind of visual language.
As a cohort, we are interested in the things ignored, the unquantifiable. What is categorized or collected is seen or observed, and this creates a double-edged sword of visibility and invisibility. In our weekly meetings we make ourselves visible, and we learn each other’s style. Everyone has a different point of view, and it’s notable how we have been conditioned to stifle our perspectives and be more “objective” when dealing with data. But being in touch with each other’s work shows that there are multiple ways to look at things.
By collecting, arranging, and visualizing our personal data, we became more rounded, more dimensional. We are able to see and share new parts of ourselves with each other through the data of our daily lives. Data is a record of the way things were—if we’re lucky, it can show the way things are now.
Some findings:
Chinese Cyber Feminism Archive
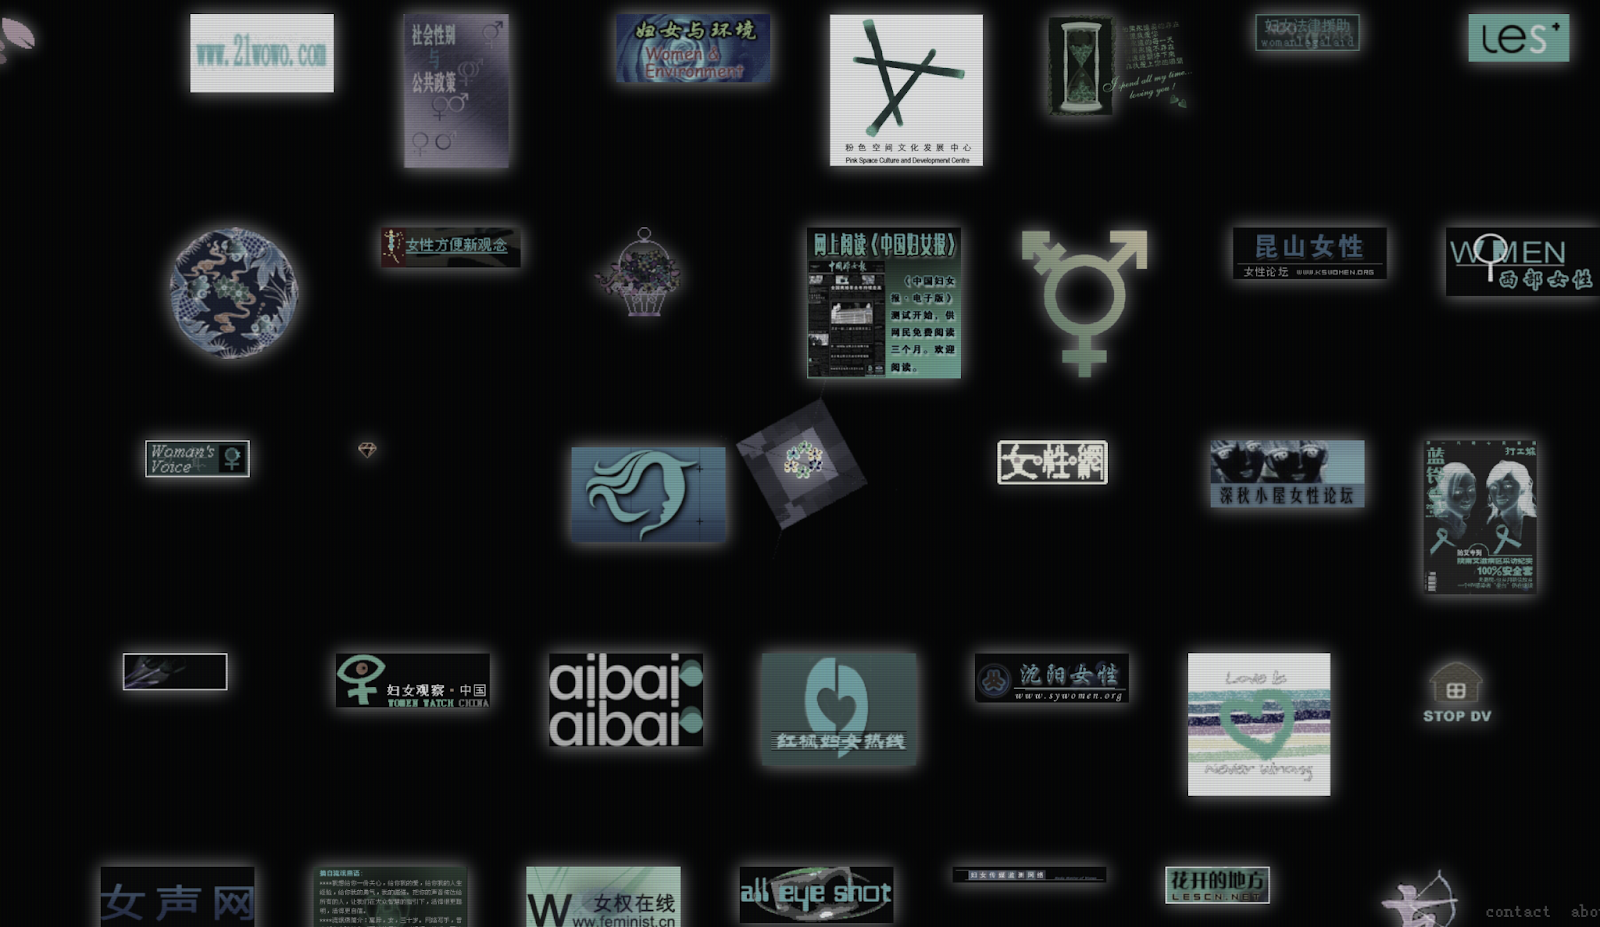 Screenshot of a web page with a black screen and a collage of muted logos from Chinese feminist websites of the 2000s. By Crassula.
Water logs
A flowing conversation between friends.
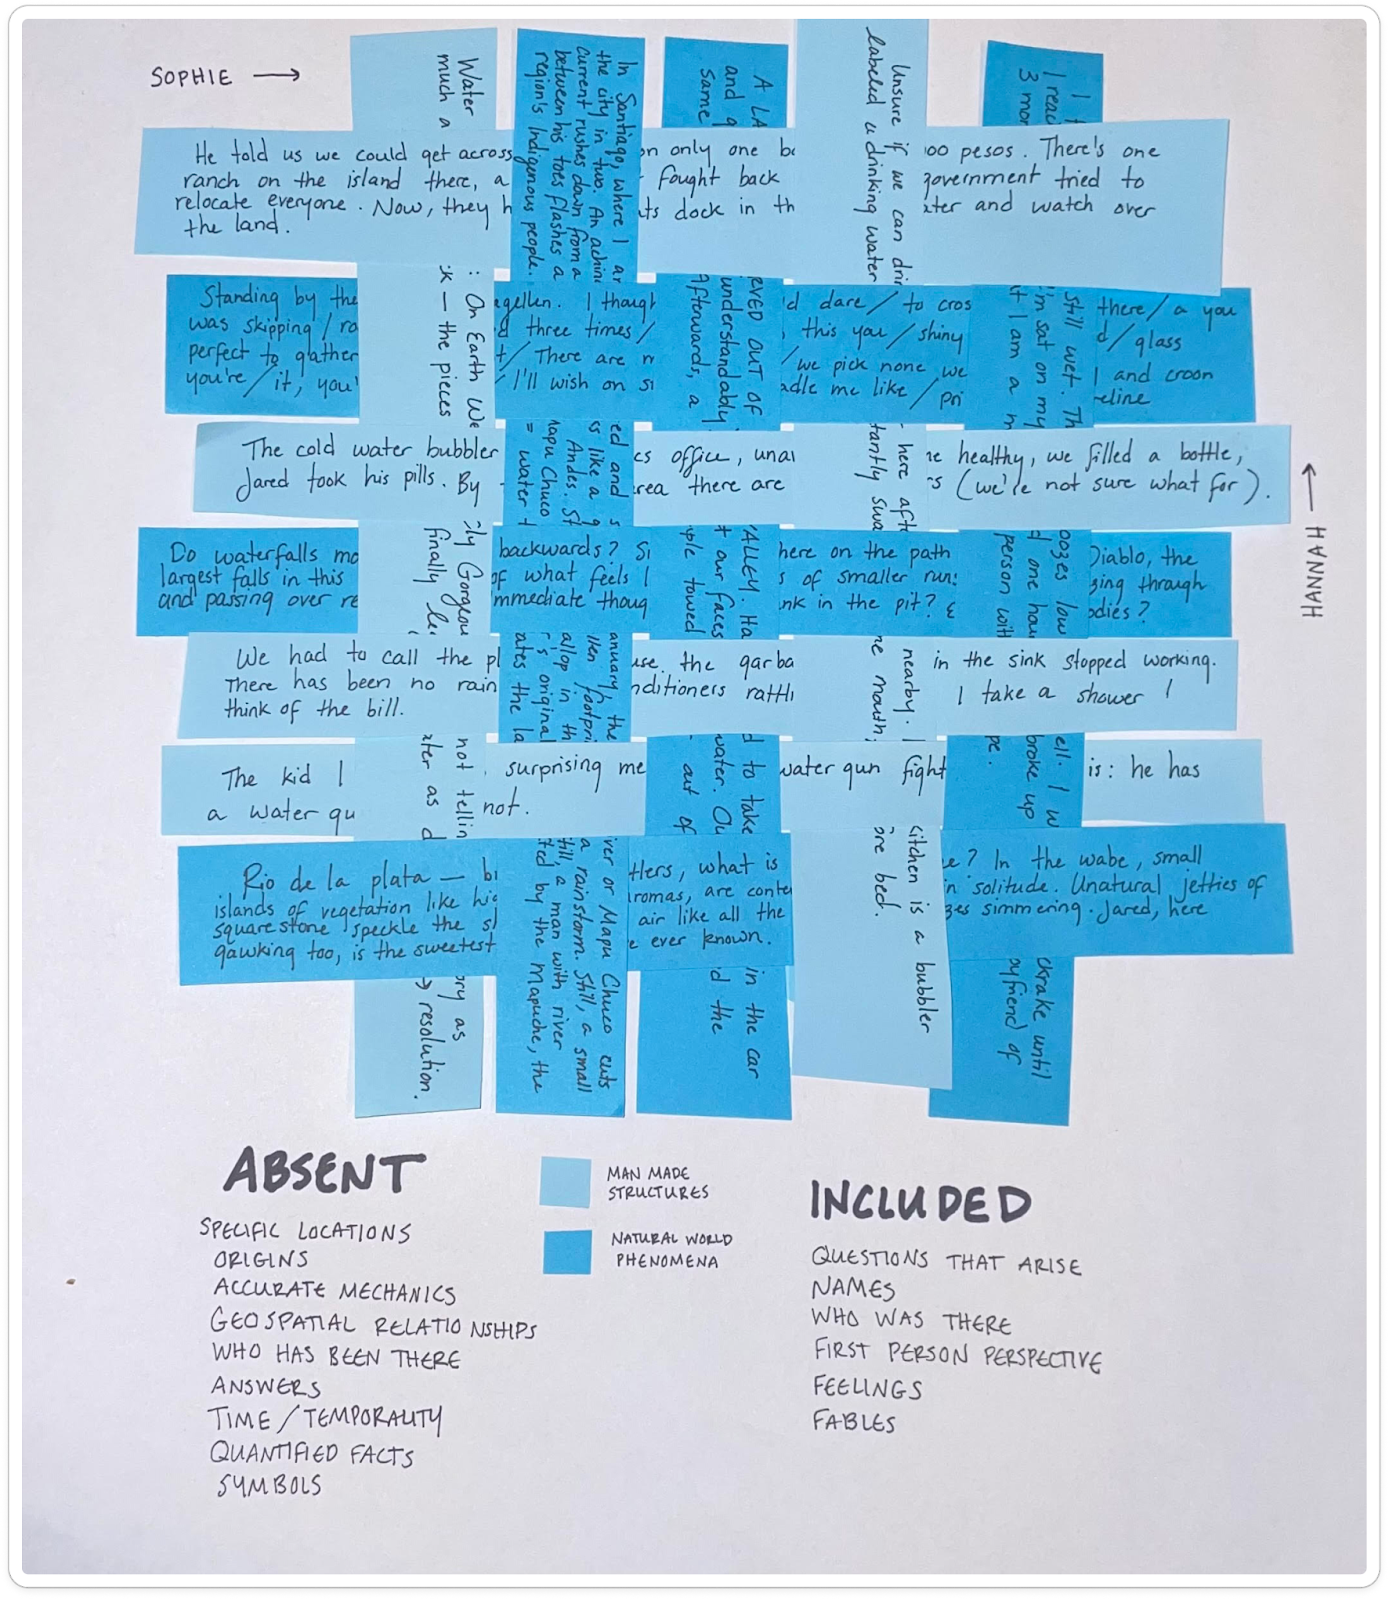 Note cards in two shades of blue, with flowing hand written text, arranged in to a weaving. The key at the bottom shows that the lighter blue indicates a reference to manmade structures while the darker blue have references to natural phenomena. Sophie is on the x axis and Hannah on the y axis]. By Sophie.
Consequences of Neglect
Visualizing messages left unread and the possibilities of reconnection.
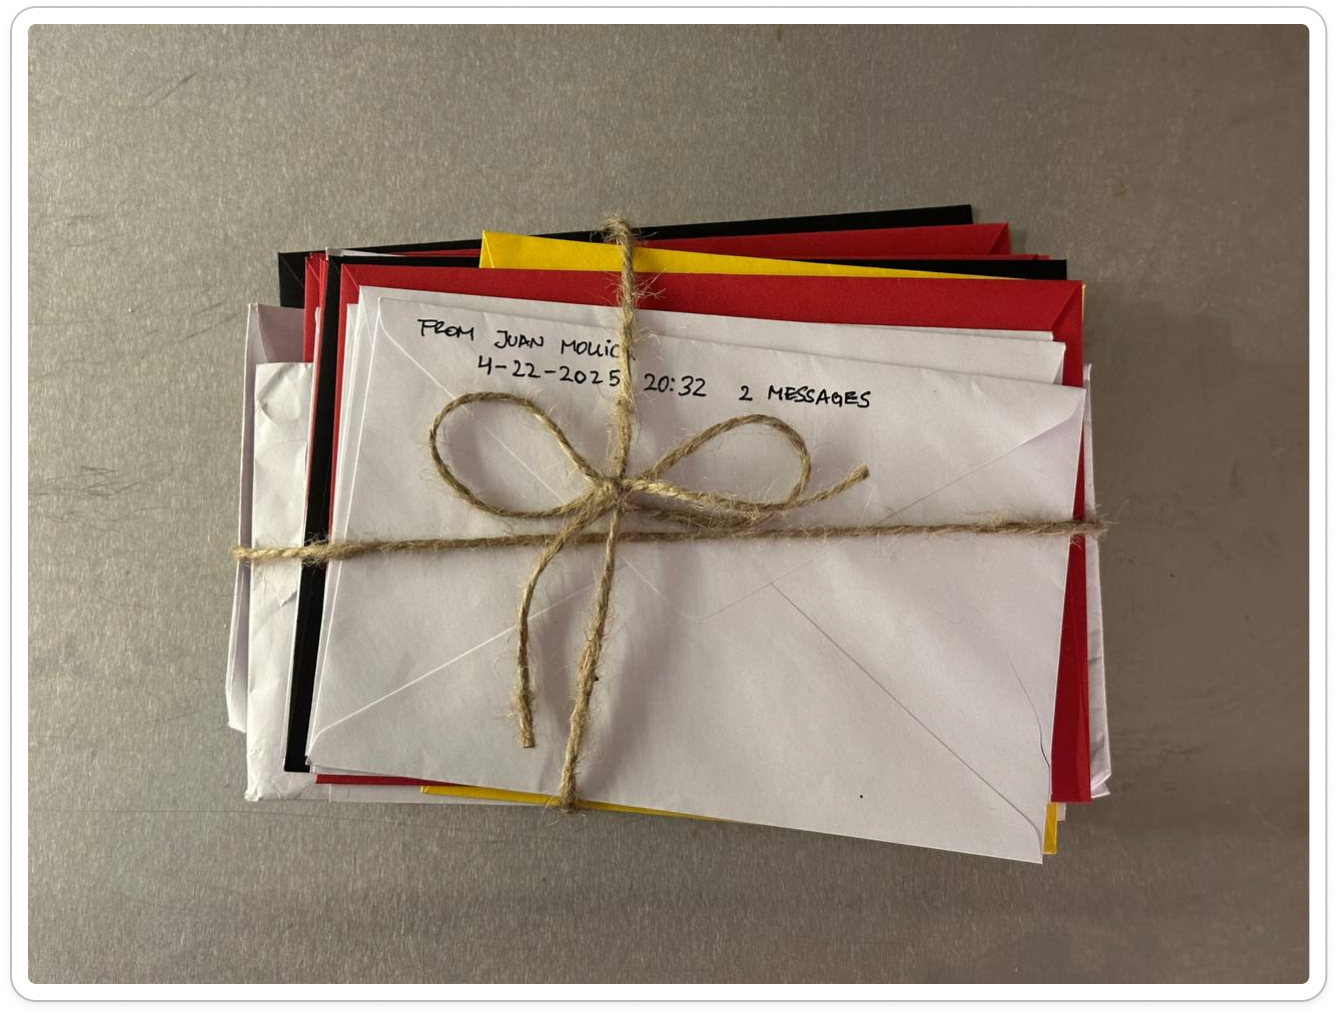 Stack of envelopes in whit yellow red and black, tied with a bow of twine. The back of the white envelope on the top reads in handwritten text “ from Juan M… 4.22.2025 20:32 2 messages”.
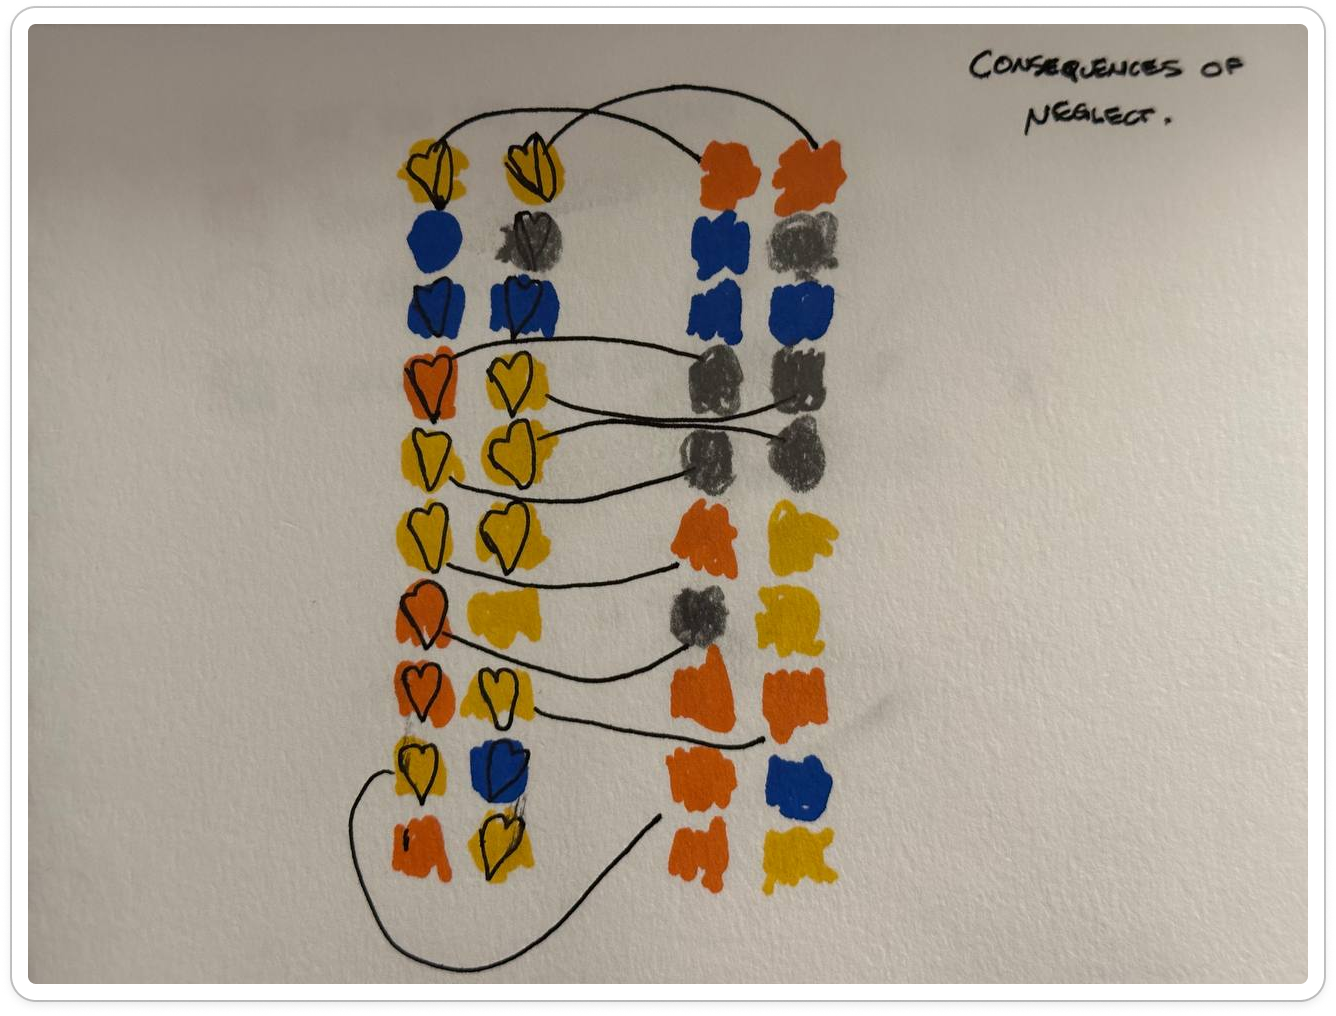 Visualization with hearts, vertical columns and connecting lines, exiled “consequences of neglect”. By Manuel.
Digital Noise
“Visualizing my open tabs on my browser from Monday to Friday. Each yarn colour = a different day. Each stitch represents an open tab. Pictured: front and back.
Been very excited about hacking an old knitting machine. Have been knitting images from Computer Vision training papers, a few are on my website (these were hand-knit, have not yet updated it with knit-hack experiments...yet)”
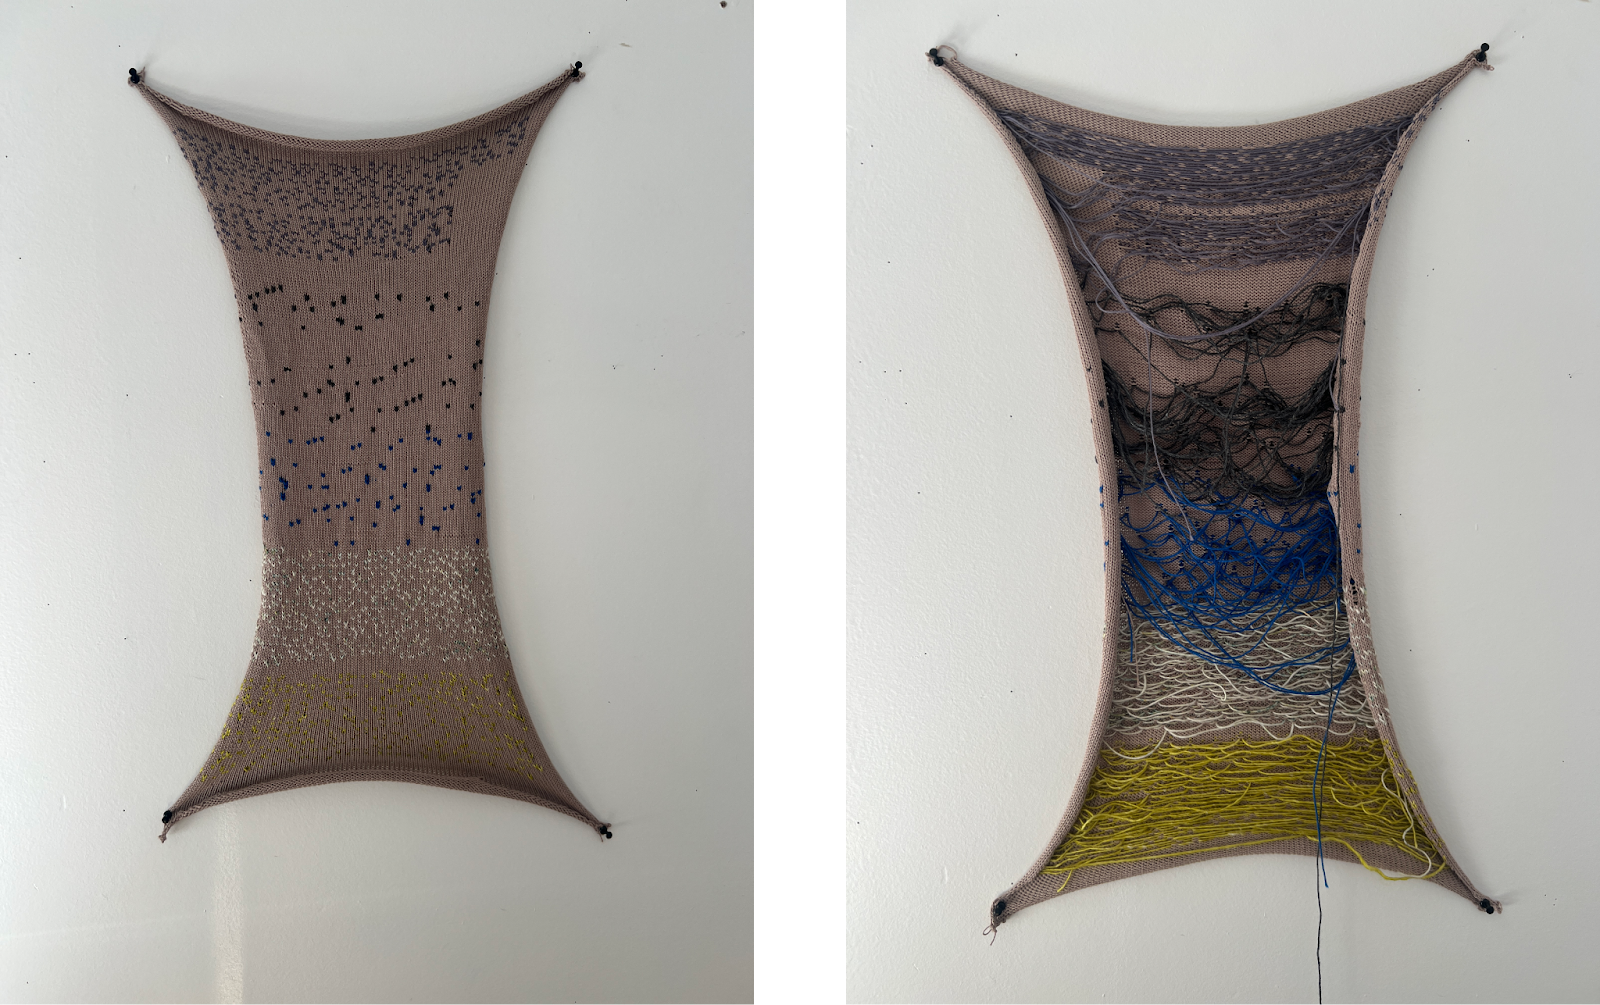 Front of a tightly knit weaving that is splayed out and pinned to a surface. It is taupe brown with blue, white and yellow. Right, back of the weaving revealing the messy stitches underneath. Weaving By Hayley.
Past and Future Collide
Visualization of “given the choice, would you rather go back in time to meet your ancestors, or into the future to meet your descendants?”.
Fruits for the past, flowers for future.
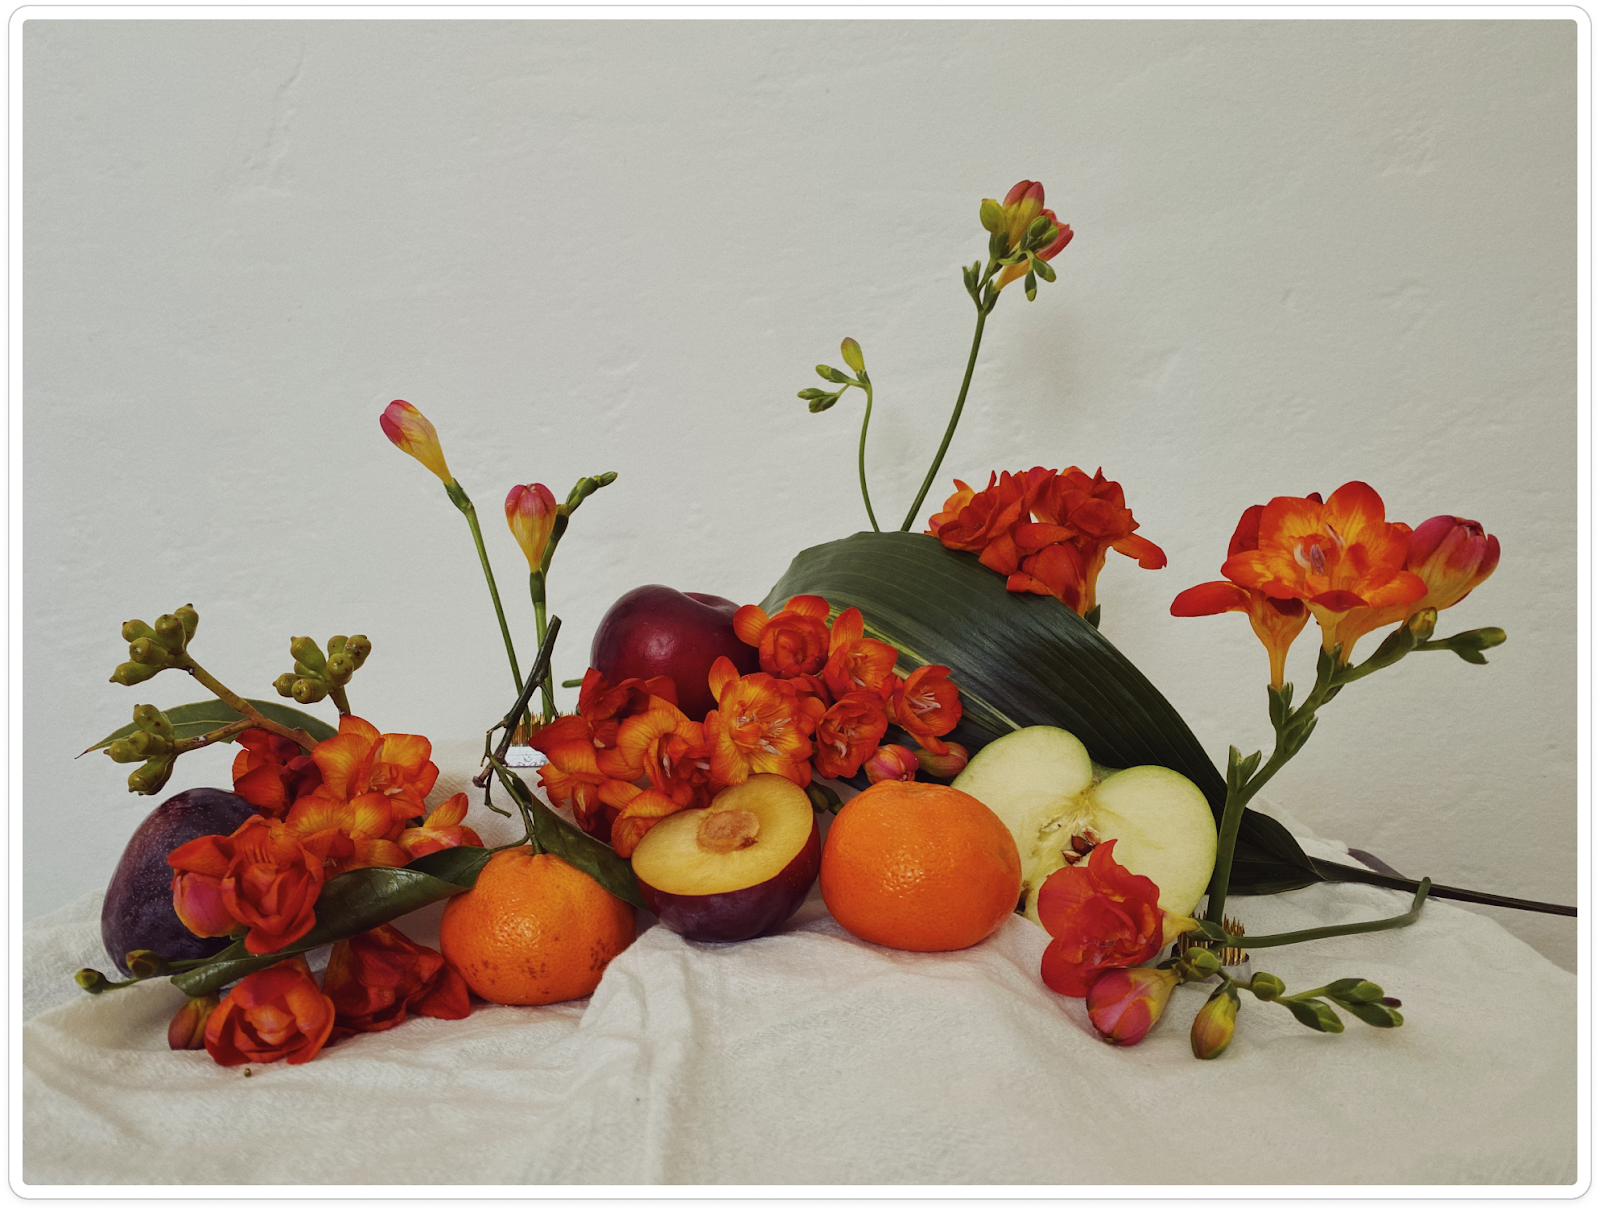 Photograph of a still life using freesia, clementine, cut plum and apple. Arranged on a white table cloth. Still life by Nora.